Subscribe

Subscribe

How to Create a High-Quality Data Dictionary or Codebook


A data dictionary (also called a codebook) is one of the most important pieces of documentation you will ever create for your research dataset. It is essentially the “user manual” for your data — without it, even the cleanest spreadsheet or database becomes difficult, if not impossible, for others (and often your future self) to understand and reuse.                       

In this blog post, we'll explain what a data dictionary, or codebook, is and why it's so important in research data management. We then explore the essential steps and best practices for creating a robust data dictionary or codebook and provide a practical guide for researchers.


15 Apr 2026

[3 min read]

                
Read More

What is a Data Dictionary or Codebook?

A data dictionary, also known as a codebook, is a detailed description of the data in a dataset. It includes information about each variable, such as its name, type, format, possible values, and meaning. Essentially, it acts as a "user manual" or roadmap for anyone who needs to understand, work with, or reuse the data.


What is the difference between a Data Dictionary and a Codebook?

  • Data Dictionary: Focuses on variables — what each column means, its type, units, valid values, missing-value codes, etc. Most common for tabular/quantitative data.
  • Codebook: Broader term that also includes study-level information (questionnaire text, survey flow, sampling method, data collection process). Very common in social sciences and survey research.

In practice, most researchers use the two terms interchangeably.


Why does a high-quality Data Dictionary matter?

  • Many funders and journals require submission of Data Management Plans. A high-quality data dictionary will definitely expedite approval processes.
  • It provides clarity on what each variable represents, making it easier for users to interpret the data correctly. As a result, the citation rate of your dataset will be increased.
  • By documenting the data structure and constraints, it helps maintain data integrity and consistency. Hence, errors can be reduced when others (or you) work with the data.
  • Analysts can effectively identify variables and understand their context, which enables secondary analysis and meta-analysis.
  • Makes your data FAIR (Findable, Accessible, Interoperable, Reusable) compliant.


Step-by-Step: How to create a high-quality Data Dictionary

  1. Decide the Scope and Format
    • Use a simple spreadsheet-style dictionary for Tabular data such as Excel, CSV, SPSS, Stata, R, etc.
    • Use a full codebook with question text for Survey / Questionnaire data
    • Combine both for Mixed or Complex data
    • Recommended formats:
      • Excel / Google Sheets (most accessible)
      • Markdown table (easy to put in README files)
      • PDF (the final archival version)
      • JSON / XML (machine-readable, advanced)
  2. Include all essential fields
    Column / Section What to put here Example
    Variable name Exact column name in the dataset income_2023
    Variable label Human-readable description (1–2 sentences) Annual household income in HKD (2023)
    Question text (if survey) Full wording of the survey question “What was your total household income last year?”
    Data type Numeric, String/Text, Date, Categorical, Boolean, etc. Numeric
    Units e.g., HKD, kg, %, years, etc. HKD
    Value range / Valid values      Minimum, maximum, or list of allowed values 0 – 9999999
    Value labels For categorical variables: code → meaning 1 = Full-time employed, 2 = Part-time, 3 = Unemployed   
    Missing value codes How missing data is coded -99 = Refused, -88 = Don’t know
    Measurement level Nominal, Ordinal, Interval, Ratio, Binary Ratio
    Derivation / Calculation If the variable was calculated from others = income_monthly * 12
    Source / Instrument Which questionnaire, sensor, or database it came from     Wave 3 Household Survey
    Notes / Caveats Any special instructions or known issues Some respondents refused to answer
  3. Build it systematically
    • Start early - Begin drafting while you are still collecting or cleaning data.
    • Use a template (refer to Step #4)
    • One row per variable — never combine multiple variables in one row
    • Be consistent — Use the same style and level of detail for every variable.
    • Include a cover sheet with:
      • Dataset title
      • Version number and date
      • Number of variables and observations
      • Principal Investigator / Contact person
      • License
      • Citation recommendation
  4. Utilize tools and templates

    Recommended free templates:

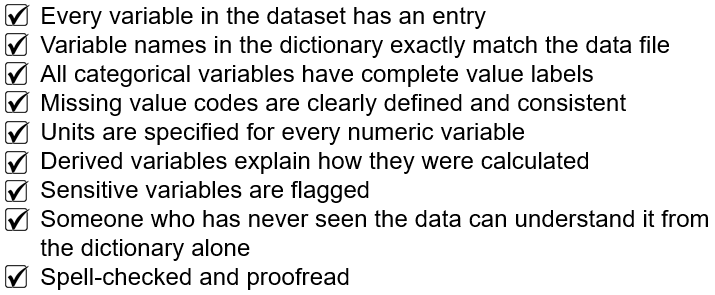
  5. Final review with a quality checklist


An example: Small excerpt from a real data dictionary

Variable Label Type Values Missing codes
age Respondent age in years Numeric 18–99 -99
gender Gender Categorical    1 = Male, 2 = Female, 3 = Non-binary, 4 = Prefer not to say   -88
income_monthly Monthly household income (HKD) Numeric 0–999999 -99
education_level   Highest education level completed    Ordinal 1 = Primary, 2 = Secondary, 3 = Bachelor, 4 = Postgraduate    -99


Conclusion

Creating a high-quality data dictionary or codebook is a crucial step in effective Research Data Management. By providing a clear and comprehensive guide to your dataset, you enhance data understanding, quality, and collaboration. Follow the steps and best practices outlined in this blog to develop a data dictionary that serves as a valuable resource for all data users. Remember, a well-crafted data dictionary is not just a document—it's a key to unlocking your data's full potential. A good data dictionary takes time (usually 1–3 days for a medium-sized project), but it is one of the highest-ROI activities in RDM. It turns a “data file” into a reusable scientific asset.

Highly Cited Researchers 2025 List Released by Clarivate


Highly Cited Researchers from Clarivate is an annual recognition of influential scientists and social scientists worldwide who have demonstrated significant and broad influence in their fields of research. The list highlights recent research accomplishments, evaluating Highly Cited Papers published in reputable journals indexed in the Science Citation Index Expanded™ and Social Sciences Citation Index™ over an 11-year timeframe. 

19 Nov 2025 

[2 min read]

Read More
  • 2025 Highlights:
    In the 2025 edition, a total of 6,868 researchers from 60 countries and regions were acknowledged, resulting in 7,131 Highly Cited Researcher designations. Some individuals were recognized in multiple subjects, showcasing their interdisciplinary expertise. This prestigious recognition honors researchers whose publications rank in the top 1% by citations within the 2014-2024 publication year range, representing the most cited 0.1% of scholars in the sciences and social sciences. 

  • Methodological Adjustments in 2025:
    The methodology for the 2025 list of "Highly Cited Researchers" has undergone significant changes this year, primarily focusing on adjustments to the selection of highly cited papers and the application of existing selection standards. These adjustments have impacted various academic disciplines, resulting in 12 ESI (Essential Science Indicators) subject categories experiencing a decline in the number of researchers selected compared to last year. Notably, the new changes have enabled the category of Mathematics to return to the list after being excluded for the past two years due to concerns over suspicious citation patterns. 

Researchers from City University of Hong Kong (CityUHK) have excelled on the 2025 Highly Cited Researchers list, ranking ninth in Asia and second in Hong Kong. Access detailed records of CityUHK researchers on CityUHK Scholars: 2025 
 

Identifying Top Research with Normalized Indicators

TA

Normalized article-level metrics move beyond raw citation counts to reveal how individual papers truly perform within their specific fields, publication years and types, and against global benchmarks. From field-normalized measures like Field-Weighted Citation Impact (FWCI) and Category Normalized Citation Impact (CNCI) to elite designations such as Highly Cited Papers and Hot Papers, these tools offer a nuanced view of research influence.

25 Mar 2026

[2 min read]

Read More

These metrics are accessible via leading research analytics platforms: Scopus-powered SciVal for FWCI and percentile-based counts, and Web of Science-fed tools like InCites, Journal Citation Reports (JCR), and Essential Science Indicators (ESI) for CNCI, journal quartiles, and top paper recognitions. While methodologies differ, the core aim remains consistent: normalize for fairness so high performers stand out regardless of context.

Metrics Comparison Tables by Data Sources

Data source / Tool

Scopus / SciVal

Metric

Field-Weighted Citation Impact (FWCI)

Outputs in Top Citation Percentiles

Publications in Top Journal Percentiles

Publications in Journal Quartiles

Publication coverage

1996 -

1996 -

1996 -

1996 -

Publication types

All types

All types

All types with journal metrics

All types with journal metrics

Citations

Citations from the publication year plus following 3 years

All citations; can show as field-weighted

Journal-level citations by CiteScore, SCImago Journal Rank (SJR), or Source-Normalized Impact per Paper (SNIP)

Journal-level citations by CiteScore, SCImago Journal Rank (SJR), or Source-Normalized Impact per Paper (SNIP)

Subject filed

All Science Journal Classification Codes (ASJC)

All Science Journal Classification Codes (ASJC)

ASJC for CiteScore and SJR;
Not required for SNIP

ASJC for CiteScore and SJR;
Not required for SNIP

Threshold

Publication-level:

>1: above world average
=1: world average
<1: below world average

Publication-level:

1%
5%
10%
25%

Journal-level:

1%
5%
10%
25%

Journal-level:

Q1 (top 25th percentile)
Q2 (26 – 50th percentiles)
Q3 (51 – 75th percentiles)
Q4 (76 – 100th percentiles)

Normalized by

Publication type, publication year, and subject field

Publication year

Publication year and/or subject field

Publication year and/or subject field

Data source / Tool

Web of Science (WoS) / InCites / Journal Citation Reports (JCR) / Essential Science Indicators (ESI)

Metric

Category Normalized Citation Impact (CNCI)

Percentile in Subject Area

Documents in Top 1% / 10%

Documents in Q1-Q4 Journals

Highly Cited Papers

Hot Papers

Publication coverage

1980 -

1980 -

1980 -

1980 -

Past 10 years

Past 2 years

Publication types

All types

All types

All types

All types with journal metrics

Regular scientific articles and review articles from Science Citation Index Expanded (SCIE) and Social Sciences Citation Index (SSCI)

Regular scientific articles and review articles from Science Citation Index Expanded (SCIE) and Social Sciences Citation Index (SSCI)

Citations

All citations

All citations

All citations

Journal-level citations by Journal Impact Factor (JIF)

Citations from SCIE, SSCI, and Arts & Humanities Citation Index (AHCI) over the 10-year period

Citations from SCIE, SSCI, and Arts & Humanities Citation Index (AHCI) over the most recent 2-month period

Subject filed

WoS Research Areas

WoS Research Areas

WoS Research Areas

WoS Research Areas

ESI Research Fields

ESI Research Fields

Threshold

Publication-level:

>1: above world average
=1: world average
<1: below world average

Publication-level:

99th - 100th: Top 1%
90th - 100th: Top 10%

<89th: Others

Publication-level:

Top 1%
Top 10%

Journal-level:

Q1 (top 25th percentile)
Q2 (26 – 50th percentiles)
Q3 (51 – 75th percentiles)
Q4 (76 – 100th percentiles)

Publication-level:

Top 1%

Publication-level:

Top 0.1%

Normalized by

Publication type, publication year, and subject field

Publication type, publication year, and subject field

Publication type, publication year, and subject field

Publication year and/or subject field

ESI research field and publication year

ESI research field and period added to WoS

Metric details can be viewed at the Library Guide on Impact of Articles.

Navigating the Landscape of Standardized Metadata Schemas in Academic Research


Metadata is a vital component of research data management, providing the necessary context and information to make data discoverable, usable, preservable, and citable. Several standardized metadata schemas have emerged, offering structured frameworks for describing data and ensuring consistency and interoperability across systems and disciplines.

In this blog post, we'll explore some of the prevailing standardized metadata schemas used in academic research, delve deeper into each schema, compare their features, and discuss practical use cases.


18 Mar 2026

[3 min read]

Read More

Prevailing Standardized Metadata Schemas


  1. Dublin Core

    OverviewDublin Core is a simple yet flexible metadata schema used across various disciplines. It consists of 15 core elements, making it suitable for a wide range of data types.

    • Core metadata fields: Title, Creator, Subject, Description, Publisher, Contributor, Date, Type (The nature or genre of the content. Controlled vocabularies like the DCMI Type Vocabulary can be used), Format (The file format, physical medium, or dimensions of the resource. Controlled vocabularies such as MIME types may be applied), Identifier (A unique reference, such as a URL or DOI), Source, Language (Controlled vocabularies like ISO 639 language codes are often used), Relation, Coverage, and Rights.
    • Structure: Dublin Core is designed to be simple and flexible, allowing for both minimal and detailed descriptions. It can be expressed in various syntaxes, including JSON, HTML, XML, and RDF. Its structure is very flat and human-readable.
    • Best fit: General-purpose, cross-disciplinary, digital libraries, and any project that needs quick, lightweight metadata.
    • Use cases: Institutional repositories, open-access journals, OAI-PMH harvesting, and basic dataset landing pages.
    • Strength: Extremely simple and widely supported.
    • Weakness: Too basic for complex research data (no version history, no funding info, no spatial/temporal granularity).
  2. DataCite Metadata Schema

    OverviewThe DataCite Metadata Schema is specifically designed for research data, facilitating data citation and sharing.

    • Core metadata fields: Identifier (typically a DOI), Creator, Title, Publisher, Publication Year, Resource Type (E.g., dataset, software, or image. Controlled vocabularies like the DataCite Resource Type General), Version, Description, Geo-location, Rights, and Funding Reference.
    • Structure: DataCite metadata is structured in XML format, allowing for detailed and machine-readable descriptions. It supports linking between datasets and related publications.
    • Best fit: Any discipline that assigns DOIs to datasets.
    • Use cases: Citing datasets in scientific publications and managing research data in institutional repositories. 
    • Strength: Excellent for citation, versioning, and discoverability. Mandatory fields ensure minimum quality.
    • Weakness: Less rich for highly structured social-science surveys or geospatial data.
  3. ISO 19115

    OverviewISO 19115 is a comprehensive schema for geospatial data, providing detailed descriptions of geographic information and services.

    • Core metadata fields: File Identifier, Language (Controlled vocabularies like ISO 639 language codes are often used), Character set (the character encoding used), Hierarchy Level, Contact, Date Stamp, Spatial Representation (e.g., vector, raster), Extent (the spatial and temporal extent of the dataset), Lineage, Constraints, and Distribution Information.
    • Structure: ISO 19115 is structured in XML and is highly detailed, supporting complex descriptions of geospatial data.
    • Best fit: Geography, GIS, remote sensing, environmental science, oceanography.
    • Use cases: Documenting geospatial datasets in environmental research, managing spatial data in government agencies and NGOs, National mapping agencies, INSPIRE directive (Europe), USGS, satellite data portals.
    • Strength: Extremely rich spatial and temporal metadata.
    • Weakness: Heavy and complex for non-geospatial data.
  4. MODS (Metadata Object Description Schema)

    OverviewDeveloped by the Library of Congress, MODS is used for bibliographic data and includes elements like Title, Name, Type of Resource, and Language.

    • Core metadata fields: Title, Name of Creator/Contributor, Type of Resource, Genre, Origin Information, Language (Controlled vocabularies like ISO 639 language codes are often used), Physical Description, Abstract, Subject, and Identifier.
    • Structure: MODS is XML-based, allowing for rich and hierarchical descriptions of bibliographic records.
    • Best fit: Digital repository metadata, interoperable resource description, detailed bibliographical records, and MARC to XML conversion.
    • Use cases: Cataloging books, articles, and other bibliographic materials in libraries and managing metadata for digital collections in cultural heritage institutions.
    • Strength: Richness and granularity, compatibility and interoperability, user-friendly syntax, flexible XML structure, and reduced complexity.
    • Weakness: Lack of mandatory fields, no built-in business rules, and loss in conversion (non-round-tripable, i.e., converting from MARC to MODS and back to MARC can result in a loss of specific data or granular tagging)
  5. VRA Core

    OverviewVRA Core is used in the visual resources community, designed for describing images and works of art.

    • Core metadata fields: Work type (e.g., painting, sculpture), Title, Agent (the creator or contributor), Material (Controlled vocabularies like AAT may be used), Technique (Controlled vocabularies like AAT may be used), Cultural context, Location, and Subject.
    • Structure: VRA Core is XML-based, providing a structured format for describing visual resources.
    • Best fit: Cultural heritage management, Digital image repositories, Academic and Special Collections, and Hierarchical relationship mapping.
    • Use cases: Documenting art collections in museums and galleries and managing visual resources in academic institutions.
    • Strength: Specialized for art/images, XML standardized, work-image relationship, and user-friendly interface (e.g., Omeka with a well-integrated data entry interface)
    • Weakness: Implementation complexity of the relational structure of VRA Core 4.0, data migration issues, and lack of adoption by some platforms like ARTstor.
  6. Darwin Core

    OverviewDarwin Core (DwC) is a standardized vocabulary, maintained by TDWG, designed to facilitate the sharing and integration of biodiversity data. It provides consistent terms (labels and definitions) for documenting organism occurrences, specimens, and samples. It is widely used to share data on GBIF through structured text files, often packaged as Darwin Core Archives.

    • Core metadata fields: Occurrence, Event, Location, Taxon (biological classification), Identification, Measurement or Fact, DNA, and Extension for multimedia.
    • Structure: Simple tabular (CSV) or RDF; very flexible extensions.
    • Best fit: Biodiversity, ecology, natural history collections.
    • Use cases: GBIF, iNaturalist, museum collections, ecological field studies.
    • Strength: Designed for sharing species occurrence data globally.
    • Weakness: Not suitable outside life sciences.
  7. Schema.org

    OverviewSchema.org provides a standardized, collaborative vocabulary that improves SEO (Search Engine Optimization) through richer search results (snippets, star ratings) by helping search engines understand content context.

    • Core metadata fields: Dataset, Creator, Description, License, Keywords, Temporal coverage, Spatial coverage, and Variable measured.
    • Structure: JSON-LD embedded in web pages.
    • Best fit: Any discipline that wants Google Dataset Search visibility.
    • Use cases: Institutional websites, repositories that embed structured data (Dataverse, Figshare, Zenodo all support it).
    • Strength: Broad adoption, support for multiple formats (JSON-LD, Microdata), and improved click-through rates.
    • Weakness: Potential for implementation complexity and limited applicability for niche topics.


Comparison of Metadata Schemas


Schema Simplicity Domain-Specific Interoperabiity Use Cases
Dublin Core    High  No High Libraries, archives, multimedia
DataCite Medium Yes (Research) High Research data, institutional repositories
ISO 19115 Low Yes (Geospatial) High Geospatial data, GIS systems
MODS Medium Yes (Bibliographic) Medium Libraries, digital collections
VRA Core Medium Yes (Visual) Medium Art collections, visual resources
Darwin Core Low Yes (Biodiversity) Low Ecological field studies, museum collections
Schema.org Medium No High Institutional websites


Recommendations for Researchers

  • Start with DataCite — it is the current global standard for most repositories (including Dataverse)
  • Add domain-specific extensions when needed (e.g., DDI for surveys, Darwin Core for biodiversity, ISO 19115 for GIS)
  • Always use controlled vocabularies where available — they dramatically improve search and interoperability
  • Embed Schema.org JSON-LD on your dataset landing page — it costs almost nothing and dramatically increases visibility in Google Dataset Search


Conclusion

Choosing the right metadata schema is crucial for effective data management and sharing. Each schema offers unique features and is suited to specific types of data and research fields. By understanding the strengths and applications of these standardized metadata schemas, researchers can ensure their data is well documented, discoverable, and interoperable, ultimately contributing to the advancement of knowledge and innovation.